This week’s cryptocurrency market presents a mixed bag, with Bitcoin (BTC) entering a phase of consolidation while Ethereum (ETH) and Ripple (XRP) are exhibiting signs of recovery. Over the past nine days, Bitcoin’s price has remained confined within a tight range of $94,000 to $100,000. In contrast, Ethereum has climbed approximately 3% this week, currently trading around $2,690, and Ripple has surged by nearly 7%, hovering around $2.55.
Bitcoin’s Sideways Movement

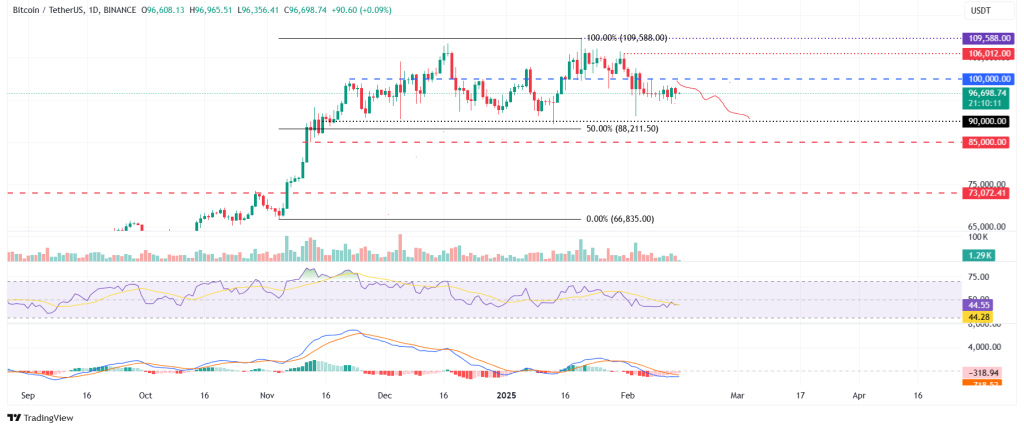
Bitcoin’s price action since February 4th has been characterized by consolidation, following a break below the $100,000 support level. Currently trading near $96,600, Bitcoin’s immediate future hinges on breaking out of this $94,000 – $100,000 range. A successful breach above $100,000 could pave the way for a recovery towards the January 31st high of $106,012.
However, technical indicators suggest caution. The daily Relative Strength Index (RSI) sits at 44, having been rejected from the neutral 50 level, signaling potential bearish momentum. Furthermore, a bearish crossover on the Moving Average Convergence Divergence (MACD) hints at possible further price corrections.
On the downside, if Bitcoin falls below $94,000, it could trigger a decline towards the significant psychological level of $90,000.
Ethereum Displays Tentative Bullish Signals

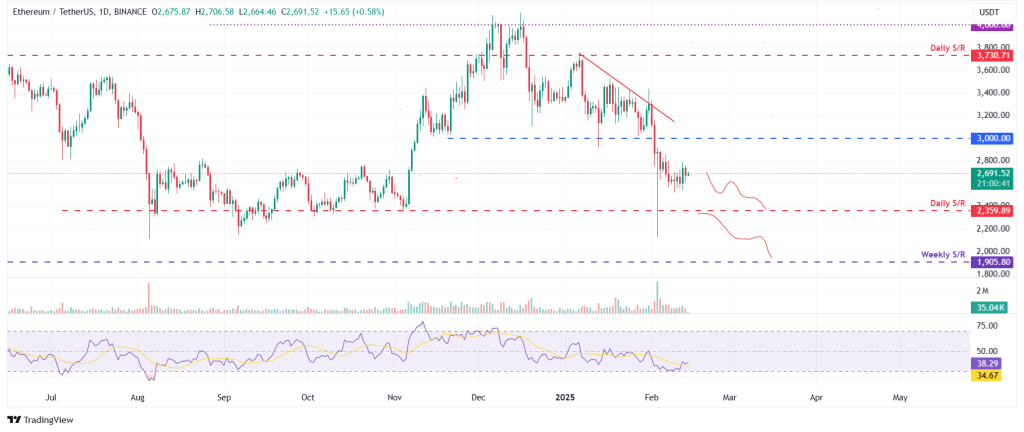
Ethereum faced resistance at a descending trendline on February 1st, leading to a 13.87% drop and a subsequent close below the $3,000 mark. Despite a nearly 9% correction the previous week, Ethereum has shown resilience this week, rebounding by roughly 3% to its current price around $2,690.
Continued recovery could propel Ethereum back towards the $3,000 level.
The daily RSI for Ethereum has bounced from oversold territory (30) to 38, indicating a reduction in selling pressure. For a sustained bullish trend, the RSI needs to climb above the neutral 50 level, which would bolster the ongoing recovery.
Conversely, if Ethereum’s recovery falters and the price drops below $2,359, further declines are anticipated, potentially reaching the next weekly support level around $1,905.
Ripple Aims to Reclaim $2.72 Resistance

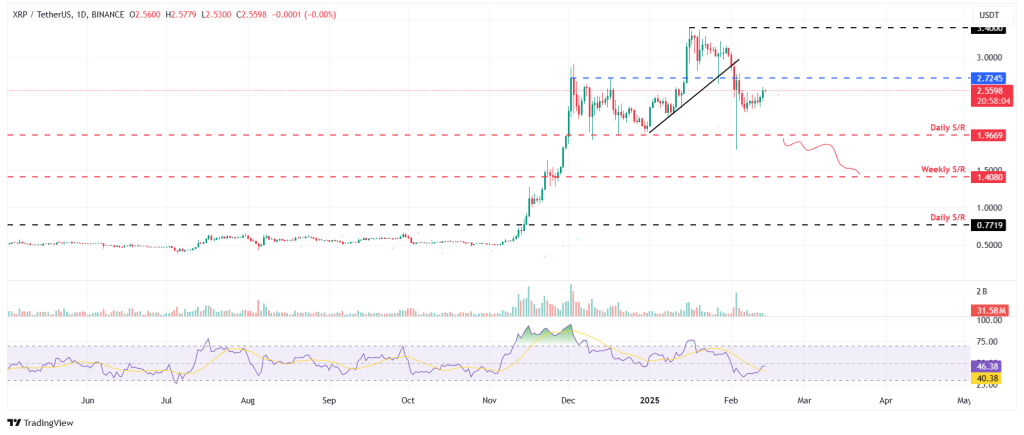
Ripple’s price broke below an ascending trendline on February 2nd, resulting in a 10.35% decrease and a close below the $2.72 support. After facing rejection at $2.72 last week and declining 11.38%, Ripple has demonstrated strength this week, recovering by almost 7% to trade around $2.55.
A sustained recovery could see Ripple retesting the $2.72 resistance level.
The daily RSI for Ripple, similar to Ethereum, has rebounded from oversold levels to 46, suggesting emerging bullish momentum. To confirm a sustained upward trend, the RSI needs to surpass the neutral 50 mark, which would support further gains.
However, should Ripple reverse its course and fall below the $1.96 support level, a deeper correction towards the weekly support level at $1.40 is possible.
In Summary
- Bitcoin: Consolidating with bearish indicators. Key levels to watch: $100,000 (resistance) and $94,000 (support).
- Ethereum: Showing early recovery signs, but needs to overcome resistance. Key levels to watch: $3,000 (resistance) and $2,359 (support).
- Ripple: Recovering and aiming to retest resistance. Key levels to watch: $2.72 (resistance) and $1.96 (support).
Traders should closely monitor these key price levels and RSI movements for potential trading opportunities in the Bitcoin, Ethereum, and Ripple markets.

Leave a Reply