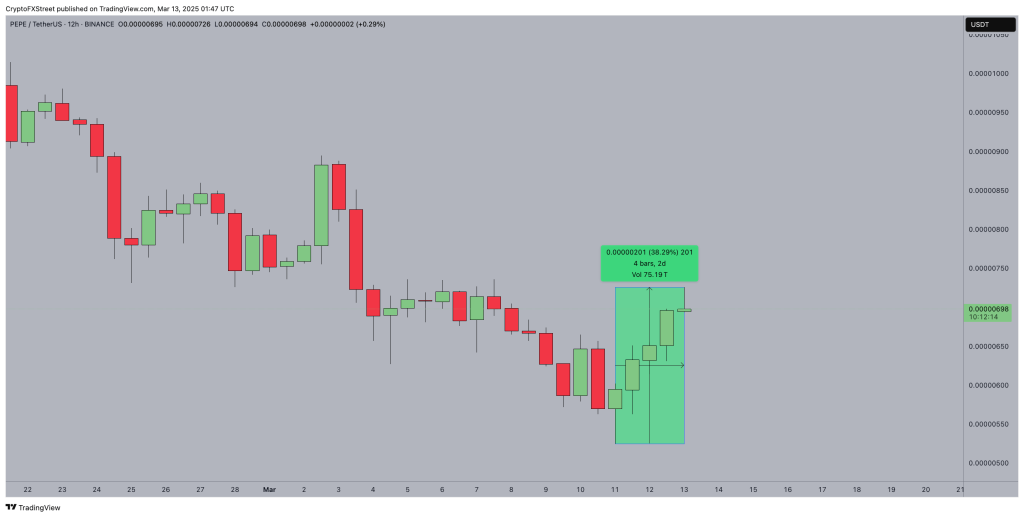
- Pepe price hit $0.00007 on Wednesday, up 33% from the year-to-date lows of $0.00005 recorded on Tuesday.
- Crypto traders leaned into top 3 memecoins as the market recovered on positive US CPI readings.
- Technical indicators on the PEPEUSD 12-hourly chart show that short-term momentum remains bullish.
Pepe (PEPE), a popular memecoin, has surged ahead of Dogecoin (DOGE) and Shiba Inu (SHIB) in the latest crypto market rally, fueled by positive U.S. Consumer Price Index (CPI) data. The memecoin sector is experiencing renewed interest as traders exhibit a higher risk appetite, injecting fresh capital into the market.

On Wednesday, PEPE’s price jumped to $0.000007, a significant 33% increase from its year-to-date low of $0.00005 just the day before. This price point marks the highest for PEPE this week and reflects a broader market recovery triggered by encouraging macroeconomic signals.
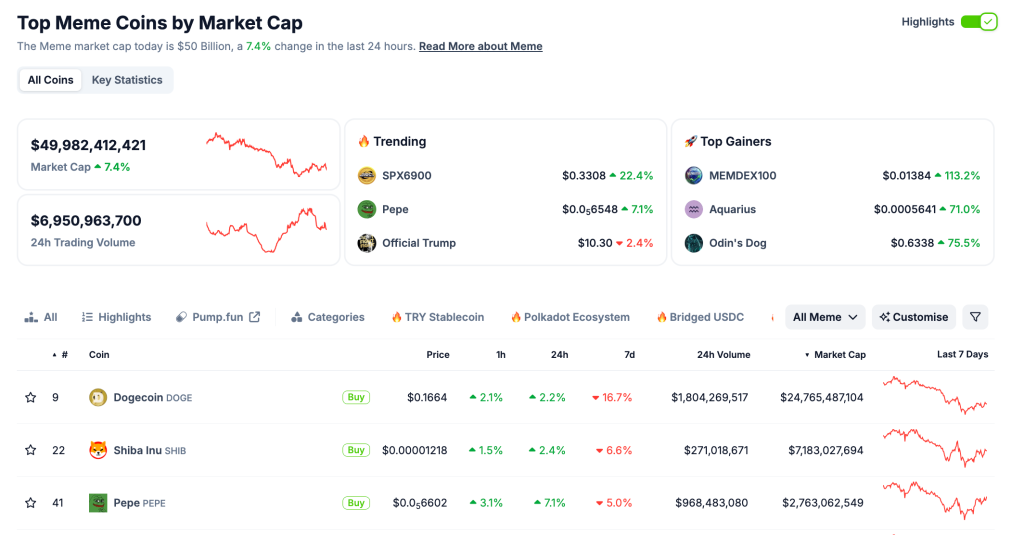
Data from CoinGecko reveals a robust inflow into memecoins, with the total market capitalization for this sector climbing by 7.4% to nearly $50 billion. PEPE has emerged as a frontrunner among top memecoins, posting an impressive 7% gain at the rally’s outset on Wednesday. In comparison, DOGE and SHIB saw more modest gains of 2.2% and 2.4% respectively over the past 24 hours.
Historically, the outperformance of memecoins in the crypto market is seen as an indicator of heightened speculative interest. These digital assets are known for their sensitivity to shifts in market sentiment and liquidity.
Technical Analysis Points to Bullish Momentum for PEPE

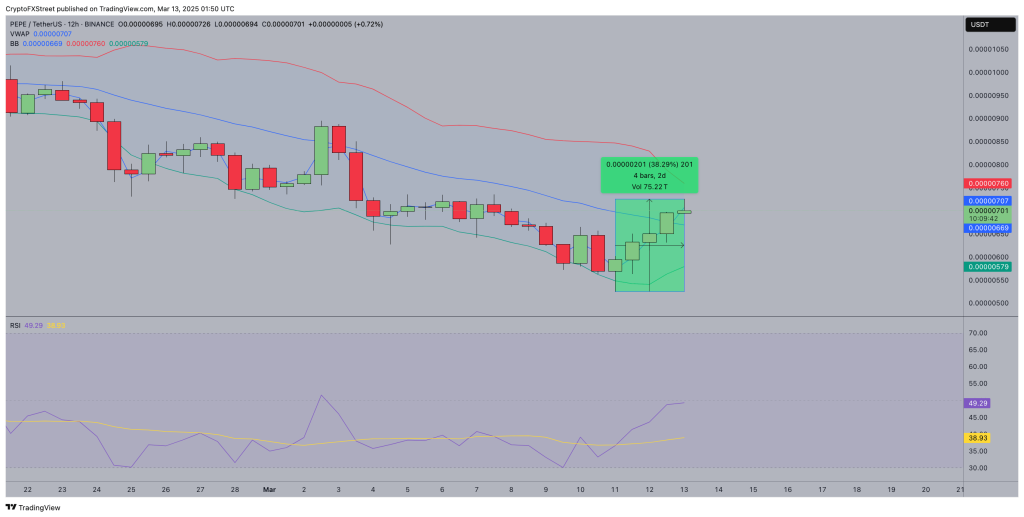
Technical indicators are reinforcing a bullish outlook for PEPE in the short term. Analysis of PEPE/USD on a 12-hourly chart reveals positive momentum. Key technical observations include:
- Bollinger Bands: Widening Bollinger Bands indicate increased volatility, with PEPE’s price currently testing the midline at $0.00000707. A sustained position above this level could pave the way for a challenge of the upper Bollinger Band at $0.00000760, potentially leading to a breakout towards $0.00000800.
- Resistance and Support Levels: Resistance is currently observed at $0.00000760. Failure to overcome this resistance could trigger selling pressure, potentially pushing the price down to the lower Bollinger Band at $0.00000579.
- Relative Strength Index (RSI): The RSI, currently at 49.29, remains neutral, indicating market indecision. A move above 55 would signal stronger bullish momentum, while a drop below 38.93 could suggest a possible reversal.
- Volume-Weighted Average Price (VWAP): The VWAP aligns with the midline of the Bollinger Bands at $0.00000707, suggesting a fairly priced market. However, rejection at this level could indicate potential unwinding of overleveraged long positions.
Market Outlook and Potential Scenarios

While bulls currently appear to be in control, maintaining key support above $0.000006 is crucial. For a sustained uptrend, PEPE needs to decisively break through the $0.00000760 resistance with increasing trading volume. Conversely, failure to hold support could allow bears to regain market dominance, potentially leading to a retracement towards $0.00000669.
Traders are advised to monitor PEPE’s price action closely around the key resistance and support levels, as well as broader market sentiment, to anticipate potential shifts in momentum. The memecoin market, while offering opportunities for significant gains, is also known for its inherent volatility and risk.

Leave a Reply